SPSS

Pearson Correlation Coefficient Between Groups

To illustrate how to compare correlation between two groups. The article would use dataset of Islamic.sav. The Questionnaire was designed to evaluate the factors that affect people’s attitude towards Islamic banking. There may be situation when you need to compare the correlation coefficient between two groups. For instance in this dataset, we may need to compare the responses between male and female respondents. How to do it is described below If you wish to follow along with this example, you should start SPSS and open the Islamic.sav file.

Variables, Hypothesis and Hypothesis Formulation

Once it has been decided that a research be conducted to solve the problem, the researcher would develop a plan or a theoretical framework. Theoretical framework help identify the factors that are important to the study and aik in development of the hypothesis.

One-Way ANOVA - Variance Analysis

Where Independent Samples T-test was used to compare a sample across two groups, there might be situations when a dependent variable might be categorized on more than two variables and then the sample is to be compared across three groups. for instance Comparing Work Stress in Junior, Middle and Senior level employees, comparing Job Satisfaction in College, Graduate and Postgraduate Education level employees or making comparison of Commitment to Change in professions as Doctors, Engineers, Teachers, Bankers and Marketers.

How to Use Pearson Correlation

To illustrate how to use Correlation I would use dataset of Islamic.sav. The Questionnaire was designed to evaluate the factors that affect people’s attitude towards Islamic banking. In this example I am interested in assessing the correlation between attitude towards Islamic banking and the Social Influence. If you wish to follow along with this example, you should start SPSS and open the Islamic.sav file.
Reliability Analysis in SPSS

Reliability Analysis in SPSS

How legitimate or justifiable a research is, that is based on an inconsistent instrument? Consistency of data is central to the concept of reliability. Reliability simply refers to the confidence a researcher places on the questionnaire to provide the same numeric value when the measurement is repeated on the same subject. How to do it is described below. If you wish to follow along with this example, you should start SPSS and open the...

Scales of Measurement

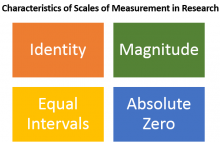
Properties / Characteristics of Scales of Measurement in Research


Scales of Measurement in a nutshell refers to various measures of the variables researchers use in their research, variables in the research are fall in one of 4 scales of measurement that will be discussed in this article. They hold prime importance in the Data Analysis, as the type of measure determine the kind of test to be used for data analysis. thus without understanding the concept of Scales of Measurement one could not have solid grasp of data analysis techniques.

Types of Measurement Scales


Operations applied to various variables from the Questionnaires in the SPSS depends on Scale assigned to the variables. Assigning a particular scale of measurement depends on the numerical properties variable have, as discussed in the last article "Scales of Measurement".

Subscribe to RSS - SPSS