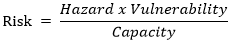
1. Basic Terminologies
Disaster
A serious disruption of the functioning of a community causing widespread human, material, economic or environmental losses which exceed the ability of the affected community to cope using its own resources. A disaster is a function of the risk process. It results from the combination of hazards, conditions of vulnerability and insufficient capacity or measures to reduce the potential negative consequences of risk.
According to NHRG (Natural Hazard Research Group) a disaster is an event meeting the below defined criteria:
i. $1 Million Losses
ii. At least 100 lives lost
iii. At least 100 people injured
Disasters are the convergence of hazards with vulnerabilities. As such, an increase in physical, social, economic, or environmental vulnerability can mean an increase in the frequency of disasters. [1]
Vulnerability
The conditions determined by physical, social, economic and environmental factors or processes, which increase the susceptibility of a community to the impact of hazards. OR
A set of prevailing conditions which adversely affect the community’s ability to prevent, mitigate, prepare for or respond to a hazard. Absence of coping strategies is also a part of vulnerability and has to be considered in vulnerability assessment e.g. living in hazard prone locations like near to a sea or river, above the fault lines, at the base of a mountain etc.
Capacity
Strengths and resources present in individuals, households and the community which enables them to prevent, mitigate, prepare for or cope with or quickly recover from a disaster e.g. availability of skilled personnel, tools and equipment, means of communication (like roads, bridges, telecommunication networks, satellite coverage etc.)
A combination of all the strengths and resources available within a community, society or organization that can reduce the level of risk, or the effects of a disaster. Capacity may include physical, institutional, social or economic means as well as skilled personal or collective attributes such as leadership and management. Capacity may also be described as capability. Some examples of capacity are: permanent houses, ownership of land, adequate food and income sources, family and community support in times of crisis, local knowledge, good leadership etc.
Resilience
Capacity of a community to resist, absorb, adjust to and recover from the negative impacts of a disaster in a timely and efficient manner.
The capacity of a system, community or society potentially exposed to hazards to adapt, by resisting or changing in order to reach and maintain an acceptable level of functioning and structure. This is determined by the degree to which the social system is capable of organizing itself to increase its capacity for learning from past disasters for better future protection and to improve risk reduction measures e.g. risk management plans, community recovery plans, ‘culture of prevention’, early warning systems, awareness programs etc. The strengthening of coping capacities usually builds resilience to withstand the effects of natural and human-induced hazards.
Peshawar Basin
Peshawar Basin refers to the districts of Peshawar, Charsadda, Mardan, Swabi and Nowshera.
2. Disaster Impact
It is the identification, classification and evaluation of the impacts of natural disasters on the lives of the community, area and the social and legal system of the area. Impacts can be expressed in terms of monetary, technical, operational, social or human criteria. They can be evaluated against predetermined segments of interest to institutions (e.g., impacts on people, the economy, the environment, national security and law enforcement).
3. Geographic Characteristics and Causes of Flood
As this study will show, District Nowshera has a high exposure to floods, and these floods have had grave physical, social and economic impacts on the district’s development in 2010.
District Nowshera covers an area of about 1800 Km2 between latitude 33º 42΄ to 34º 09΄ and longitude 71º 41΄ to 72º 15΄. Nowshera is bound by rivers from three sides; Kabul to the north and west; and River Indus to the south. (Figure 1). Moreover, it lies at the mouth of the Peshawar Basin which is encircled by hills and mountains (Figure 1). This results in a catchment area that is large (15,270 sq. Km[2]) and has only one outlet, which is District Nowshera. Water from the Mardan, Charsadda and Peshawar and Swabi districts is flowing towards Nowshera district.
The heavy Monsoon rainfall which started from 27th July and prolonged till the month of August made the rivers surge and overflow causing havoc in the target area. Areas of Risalpur and Cherat in Nowshera District received rainfall of 468 mm and 384 mm respectively, which was a new record in the areas. These rainfall systems in July-August were due to interaction of Monsoon and mid-latitude Westerlies.[3] It is worth mentioning here that the average annual rainfall in District Nowshera is 110 mm. [4]
Figure 1 Peshawar Basin encircled by Hills and Mountains
The study area is excessively vulnerable to Riverine floods in the River Kabul. The water table in the district rises during rainy season (July and August) (WAPDA, 2008b). The depth to groundwater along the Kabul and Indus rivers and in canal irrigated areas in western part is generally less than 10 m. The continued rainfall increased the water table and made the land saturated, resulting in less absorption of water and increased surface runoff.
During summer seasons, the snow accumulated on mountain tops in the winter season melts continuously causing an increase in the amount of water in the downstream rivers. This can be called a snowmelt flood. During 2010 flood season, flows in Indus and Kabul were very high and as can be seen in Figure 2 the snow cover in Kabul River basin was minimum in May and June in 2010. It clearly means that snow melting was at its peak in the flooding season of 2010.
|
Month/Year |
2013 |
2012 |
2011 |
2010 |
2009 |
2008 |
|
May |
24406 |
22177 |
17715 |
14845 |
19131 |
24901 |
|
Jun |
18510 |
12753 |
9545 |
8138 |
13273 |
16363 |
Figure 2 Average Snow cover in Kabul River Basin (2013-2008) sq.km [5]
With no trees there is a greater risk of soil erosion as the precipitation is not intercepted. Flood damage is greatest near the mouth of a river because wide, flat floodplains are most susceptible to damage. Deforestation along the Swat Valley's waterways made destruction caused by the massive floods of 2010 immeasurably worse. The loss of dense woodland along the streams and river banks made the downstream areas much more prone to erosion. [6]
Experts believe, and the witnesses’ accounts also reveal that the water levels rose at an alarming rate and say that inadequate forest cover in the north-west of the country was the major reason for the high speed and intensity of the floods. Locals say that in Dir, Swat and Nowshera, the floods swept away large amounts of lumber and that at one point the River Panjkora contained so much wood that the surface appeared to be black. [7]
More people are living in towns and cities. Population growth and urbanization has led to demand for land to build on - floodplains are flat and are food for housing. Concrete and tarmac, used for roads and pavements as they are impermeable, precipitation cannot infiltrate so gets into the river much more quickly. Often surface water is channeled directly into drains and sewers, so precipitation reaches the river much more quickly.
4. Flood intensifying conditionsin Nowshera
Figure 3 shows the relationship between the catchment shape (circular or elongated) and the hydrograph response. Rain falling on an elongated catchment has a diverse range of travel times before it reaches the outlet. Rain falling close to the outlet leaves the area quickly, whereas rain falling in the far end has a much longer travel time.
In the case of Nowshera, the shape of the Peshawar Basin is round (Figure 4), resulting in very small variation in travel times. Rain falling in different parts of the catchment area of Peshawar Basin will reach the outlet, which is Nowshera District, nearly simultaneous. In an elongated catchment the diverse range of travel times results in a long, but relatively flat hydrograph, whereas in a circular catchment the hydrograph is much more concentrated with a much higher peak.
If the drainage density is more, the runoff generation is more. Also, the time required to reach the peak flow is shorter in watersheds that have high drainage density. Peshawar Basin has a drainage density of 0.5746 Km/Km2 (Chen, Khan 2009) as revealed by the dense network shown in figure 4 leading to another condition for intensification of floods in Nowshera, KPK.
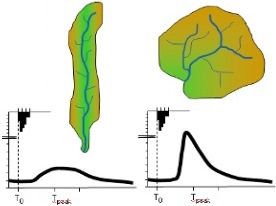
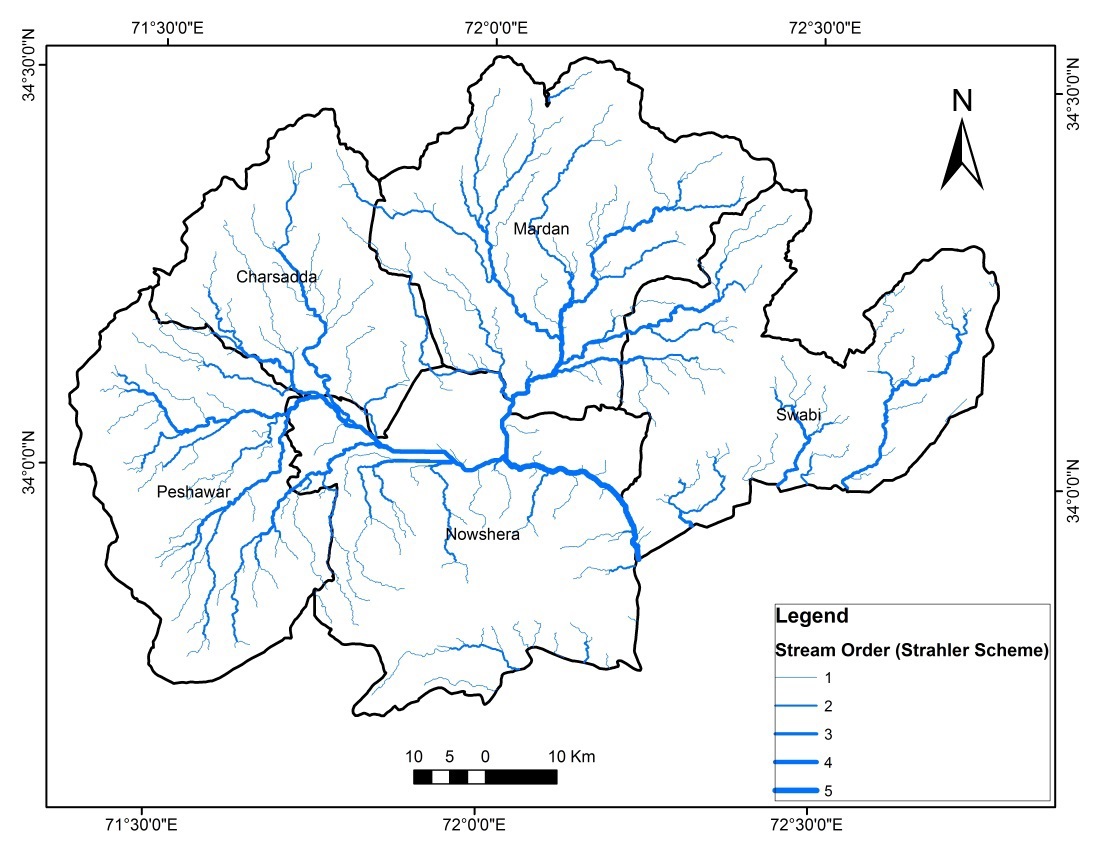
Figure 3 Catchment Shape and Hydrograph Response | Figure 4 Streams in the Peshawar basin. Source [1]
5. Flood Characteristics
The monsoon 2010 started with a normal tempo until middle of July. The hammering rains started around 18 July, with severe weather systems up to 10th September. The largest amount of rain was received on 28 - 29th July, 2010. Another intense rainfall system was observed between 5-9 August.[8]
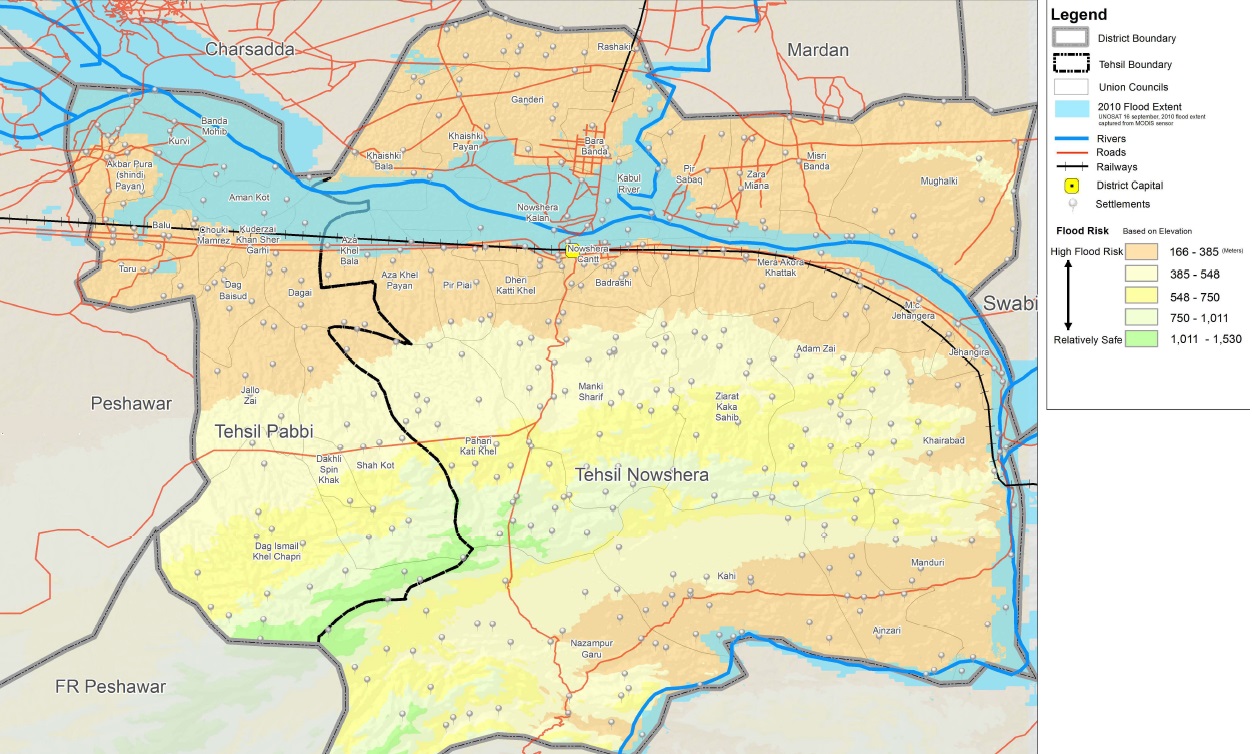
Figure 5 Flood Prone Areas in District Nowshera
Normally, the river system in Peshawar Basin (Peshawar, Nowshera and Charsadda) covers about 51 sq. km of area but during the 2010 floods it covered 330 Sq. Km of area, of which 287 sq. Km of area was covered only in Nowshera district. The maximum flow recorded in Kabul River, at Nowshera before 2010 was 1,69000 cusecs (2005) while during the 2010 floods an increase of 195% resulted in 500, 000 cusecs of flow at Nowshera. [9]
6. Impact of the 2010 Flood in District Nowshera
According to this study the primary impact categories are:
- Physical Impact – which includes fatalities and injuries, including physical injuries, displacement, chronic diseases and mental illnesses along with damage to infrastructure, water resources and other physical things.
- Society and Psycho-Social – which captures the impact of the disaster on the social interaction of people, their attitudes and emotions.
- Economy – which encompasses direct and indirect losses on the district’s economy.
- Environment – which captures the type of environmental impact, effect on wildlife, conservatories, atmosphere and ecosystems.
Provincial Disaster management Authority placed Nowshera in the “Severely Affected” list [10] pertaining to the huge losses that occurred in the area.
a. Physical Impact
The flood covered only 287 Sq. Km (15%) area of Nowshera District but unfortunately it was the most developed and densely populated region of the district. There are 68 out of 453 settlements (15%) which have been affected / inundated by 2010 flood water. There are 280 settlements (61.8%) which lie below 385 meter elevation including the capital of the district are at flood risk, based on elevation.[11] Nowshera has 42 union councils out of which 29 union councils were affected badly causing damages and destruction of 67,940 houses[12] and affecting 571,222 people.[13]
Government buildings in the affected area also sustained huge losses. The district courts in Nowshera were completely submerged and severely damaged. At least 50 percent of all records had been damaged. NADRA office in Nowshera was also completely destroyed.[14] Thousands of revenue and judicial records were also submerged in the flood water and eventually destroyed.[15]
According to National Highway Authority, Soorai bridge and a few sections of the roads in Nowshera were damaged and Reconstruction of Road N-45 (Nowshera - Chitral) and the Bridge Construction on N-45 (Nowshera-Chitral) will cost 296.57 and 508.59 million respectively.[16]
Natural as well as artificial sources and reservoirs of water were also contaminated. Heavy silting rendered 98% of water and sanitation facilities unusable and people were forced to drink water which was unfit for drinking purposes. Household latrines were unworkable due to blockages. Public drainage areas were also filled with silt and debris, resulting in large areas of stagnant water which became breeding grounds for disease carrying insects and germs. About 2,500 animals died in the study area as a result of flood which creating more opportunities for the spread of communicable diseases. [17]
The tube well water on account of its deep depth has been saved from the flood whereas the rest of the resources i.e. hand pumps, dug well, and bore well have been badly polluted due to flood water. More than 60% of samples were found unfit for drinking purpose. [18]
According to a study conducted by COMSATS Institute of Technology, sponsored by Norwegian University of Life Sciences Diarrheal diseases in Nowshera rose to 18% [19] during the flooding.
b. Social and Attitudinal impact
The natural disaster left negative psychological impacts, especially on women, also because this forced them to be in public places without proper Purdah, which was not acceptable for them culturally and psychologically. They were very concerned about the future, protection and safeguard of their children during crisis who would waste time in useless activities owing to the lack of educational facilities in the area. [20]
The disaster of 2010 also triggered huge migrations and relocations. Among the affected population, an estimated 90% families dislocated from their place of origin out of which, 34% families lived with relatives, 44% lived with strangers/host families, 10% took shelter in schools, 7% with friends, 4% in rented houses, and 1% took to self-made tents. [21] The loss of economic opportunities also forced men to migrate to other areas of the country for livelihood opportunities which complicated the problems for women who had to lose moral and social support of their men, bear the burden of raising their children alone, carry out chores of the house as well as outside the house in a male dominated society. [22]
This further intensified the problems of the affected people as the tension of the economic security and physical and emotional loss made survival difficult, resulting in reduced resilience of the community.
Governance Capacity was seriously affected as many government officials were themselves among the floods affectees and could not attend to their duties. The poor governance capacity combined with frustrations caused by general lack of access to relief assistance generated public frustration and caused serious law and order situations.[23]
Another assessment conducted by Pakistan Humanitarian Forum (PHF). And its Findings (regarding psychosocial problems of children and their families in Nowshera District) reflected that “almost all respondents expressed psychosocial trauma related to the flood, and all assessment teams found that psychosocial support is essential for the population to be able to return to a sense of normalcy and rebuild their lives”.
Literature review on the impacts of flood suggests that “the impact of a natural disaster may also cause inequalities. The poor, who suffer from income fluctuations, and also have limited access to financial services, in the aftermath of a disaster may be more prone to reduce consumption and have a decreasing shock in other household indicators as a consequence.” [24]
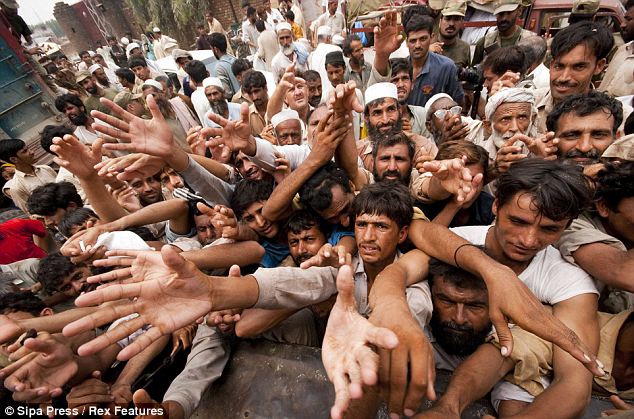
Figure 6 Pakistani army gives relief supplies to flood-affected people in the district of Nowshera [25]
Another study titled “How Natural Disasters Affect Political Attitudes and Behavior: Evidence from the 2010-11 Pakistani Floods” also found out that people living in flood-affected places turned out to vote at much higher rates. Those hit hard by the floods had more aggressive attitudes about demanding government services, and that they know more about politics. Turnout in the Pakistani national and provincial elections rose roughly 11 percentage points between 2008 and 2013 (from 44% to 55%), a massive increase. The results of the research suggested that approximately 19% of this change can be attributed to the impact of the 2010 floods.[26]
c. Economic impact
There were grave economic impacts on the community, businesses as well as government administration. People lost jobs, standing crops, running businesses and valuables like property, livestock, stored food and other necessities of the life. Furthermore, the need to re-establish their businesses and re-build their homes forced people to depend on donations. According to a study by SUPARCO, 2000 Hectares agricultural land was damaged in Nowshera District causing a projected production loss of 0.1 Million tons.[27]
Another study found out that 64% crops were destroyed in Nowshera.[28] The flood also washed away about 32 fish ponds out of 59 (54%) in Nowshera. The area of these fish ponds varied from 1 Kanal to 8 Jareb with about 2500 fish per acre of pond. The value of fish pond including fish stock ranges from 0.02 million to 1.5 million. The total damage to fish ponds caused by flood in Nowshera districts is valued at Rs. 30 million.[29]
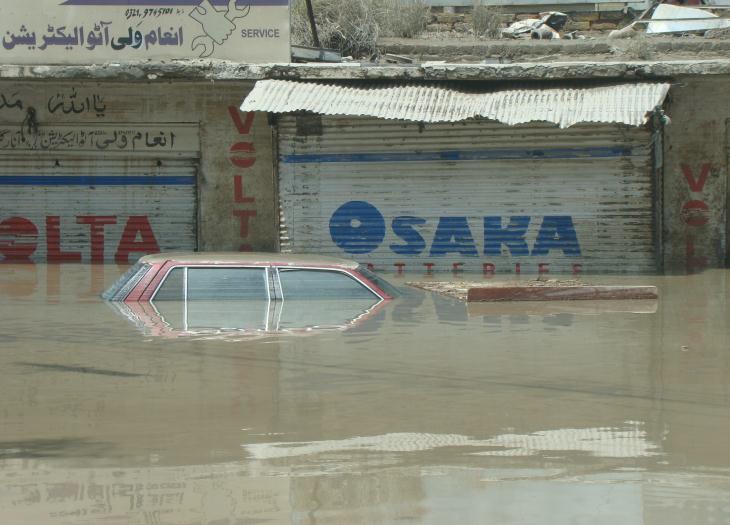
Figure 7 Nowshera Cantt. along G.T. Road. Source CDPM, UoP [30]
A total of about 68000 [31] livestock were found dead in Nowshera. This was the highest loss (30%) to the livestock sector reported in whole of Khyber Pakhtunkhwa Province.[32] The livestock killed by the flood mostly included buffalos and cows followed by goats and sheep.
Addressing a news conference at Nowshera Press Club, Nowshera Industrial Estate Association President Muhammad Ashfaq Paracha said around 70 per cent industrial units had been destroyed in the devastating floods in the district. “We have suffered huge losses owing to which we are not in a position to pay taxes. The government should provide us more loans,” he said.[33]
d. Environmental Impact
The flood caused damages to forests by washing out nurseries, natural forests, block plantations, linear plantations and loose soil along the River Kabul.[34]
The flood of July 2010 resulted in huge environmental losses in Nowshera. Agricultural fields, orchards, wildlife, parks and the whole flora and fauna of the district was badly affected. The floods washed away the vegetation cover and the upper layer of soil making the surface more prone to erosion in the future. This will also result in increased siltation downstream in the event of rains. Loss of vegetation cover will also contribute to surface run off and will result in reduced percolation and aquifer recharge rates.[35]
The local people of the community were forced to build new homes, infrastructure and undertake developmental activities using safer lands, timber and environmentally non-friendly energy resources like LPG, fossil fuels and fuel wood, causing increased strain on the environment. Most of the cow dung reserves were also flushed away which was used by the local community for fuel and fertilizer purposes, posing further threat to environment.
The loss of agricultural crops, fruit orchards, forests and natural vegetation resulted in the loss of cover, natural habitat, nesting sites and food resources for wildlife, making them easy food source in the absence of the primary food sources. These lands and reservoirs provided food to water birds and other animals and played an important role in the sustainability of the local river system.
According to a study conducted by Pakistan Wetlands Program in 2010, 50% of the trees along the River Kabul in Nowshera have been uprooted by the flood. In areas, where flood spread on large surface, minor losses were sustained by the Bela forests, Riverine forests, and Poplar plantations, but still the natural habitat of hares, hog deer, jackals, and foxes and other wildlife was completely washed away which exposed them to urban areas and poaching.[36]
The floods in the study area also filled all the nearby fields, lakes, fish ponds and other water reservoirs with silt and debris resulting in the loss of homes for tens of thousands of local and migratory birds. Only in Kund Park, a breeding centre and wildlife-based tourism spot in Nowshera district, the flood killed 219 wildlife including 37 spotted deer, six hog deer, four chinkara deer, 28 black bucks, two common leopards, two urials. Moreover, pheasants that included 21 blue Java peacocks, 19 white peacocks, eight black shouldered peacocks, five silver peasants, and 23 ring-necked pheasants were also found dead. The total value of these mammal and birds species has been estimated at 7-10 million Pak Rupees. According to the report of the same study the flood severely damaged Kund Bear Center killing 20 bears out of the 23 in the center.[37]
The flood, in several areas also affected petrol pumps. The flood not only damaged the machinery and infrastructure but also spilled the petroleum products there. According to the study of Pakistan Wetlands Program an average of 6,900 liters of oil and an average of about 1,900 liters per pump mobile oil was spilled.[38]
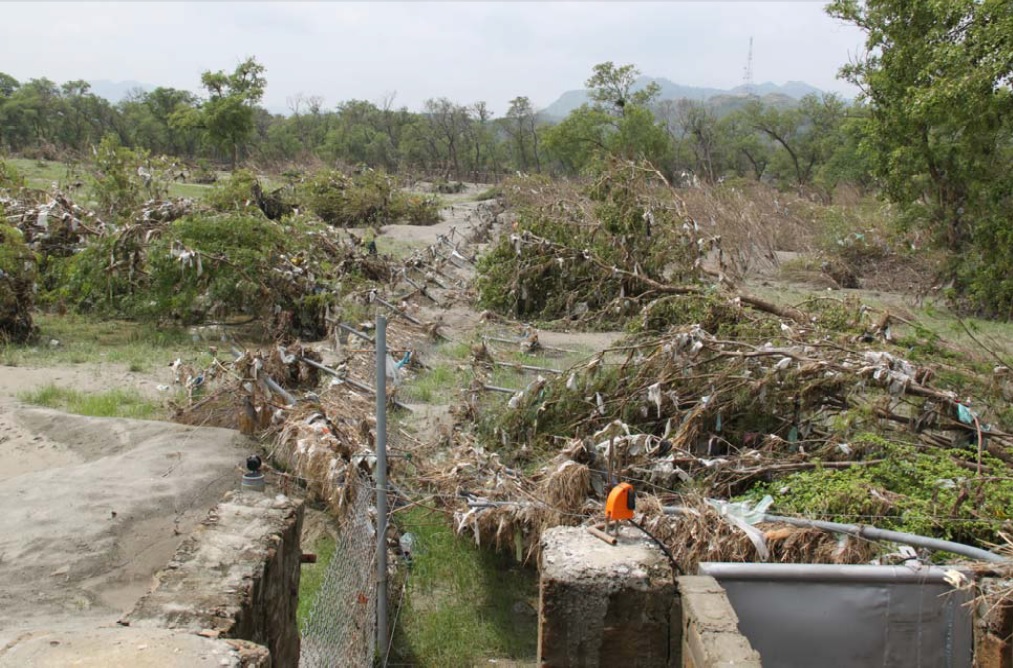
Figure 8 Glimpse of damage in Kund Park/photo Ayaz Khan, PWP [39]
Reconstruction activities gained momentum after the flood-hit Nowshera district. The prices of construction materials including cement, proper bricks and steel went beyond the purchasing power of most people. Before the floods, people could buy 3,000 bricks for Rupees. 9,000. The same were being sold for Rupees 15,000 after the disastrous flooding event.[40]
7. Measures Taken to avoid Disaster Impact
a. Structural Measures
Flood design limits. Structures such as levees, barrages, and bridges can only provide protection and safe disposal for floods that are limited to the sizes for which these structures are designed. During the 2010 flood, the peaks in the Swat River at Munda Headworks, in the Kabul River in Nowshera were much higher than the historical peaks recorded, with 100-year return periods. The flood management approach currently in use has no provisions for floods exceeding design limits.[41]
b. Non-Structural Measures
According to a study by UN-Habitat, titled “A Local HFA Monitor Update” published by Prevention Web, District Disaster Management Officers (DDMO) was found overburdened and could not give expected support (because DDRM was an additional charge with him). It also found that there was lack of Coordination among different departments regarding DRRM and DR resulting in no preparedness measures like evacuation or early warnings, resulting in extensive losses to the area and the communities living therein.[42] Likewise, the local government did not provide any support in DRR policies as the decisions were made at the higher levels and people of the community had no participation whatsoever.[43] Though, partnerships of the government and community existed at some levels but there was lack of proper information dissemination system regarding DRR and climate change.[44]
Pakistan building codes, a full fledge document, consisting of recommendations about selection of materials for construction and about the design of buildings in different geological and soil conditions is already available with the government but people were not aware about these types of codes to mitigate their losses due to different hazards. After the disaster, people have become conscious but there is dire need for the implementation of these provisions. Equally important is the implementation of Land use regulations, health and safety codes for disaster risk reduction in the future.[45]
8. Problem Areas in Disaster Impact Assessment
- Thorough disaster assessments were not done. Some measures taken by PDMA but that hazard mapping of the entire city is required.[46]
- Disaster risk assessment data not updated [47]
- In addition, the Bund Manual, a 1978 document that describes the planning, design, construction, operations, and maintenance of flood protection levees, should be thoroughly reviewed, with a view to incorporating the latest knowledge concerning levee safety.[48]
- Most fundamentally, there are no comprehensive guidelines on how damage assessments should be undertaken. Different government departments follow different practices and there appears to have been little attempt to coordinate either their scope of coverage or assessment methodologies.
- Overall damage, including some information on costs, but there is no guidance on how this damage should be valued.
- The scope of coverage and detail of reporting is limited, focusing on damage experienced by lower income groups and sub-sectors that may be eligible for public assistance. Each agency is concerned only with losses within its own mandate of activity while private sector losses are ignored. This reflects the fact that, as already noted, the primary purpose of damage assessments is to determine emergency response, relief and rehabilitation requirements.
- Assessors typically lack relevant training, adding to the uncertainty concerning the accuracy of assessments.
- There is no baseline data for use in undertaking assessment.
- There is often apparently poor coordination between agencies. Some government departments report (contradictory) information on the same category of loss. Requirements on the timing of reporting also vary. A series of reports at various points after a disaster is required by various government Departments to provide validation of impacts reported in the earlier reports but these appear to follow different schedules.
- Damage assessments are typically completed in a very short period of time, with no later attempt to assess longer-term socio-economic impacts or lessons learned in reducing future vulnerability. Post-disaster damage assessments often represent little more than stocktaking exercises, focusing on direct costs relating to damage to buildings, other infrastructure, capital equipment and standing crops and human losses.
- There can be some political massaging of figures, particularly at the national level.
9. Conclusions
A rapid assessment of disaster management in the country indicates that disaster management systems tend to rely on a reactive approach, i.e., institutional arrangements and hardware for post-disaster emergency response; preparedness measures such as evacuation plans and stockpiling of emergency supplies; and the provision of relief. Financing arrangements also tend to be reactive, with a strong reliance on humanitarian support from the international community, calamity funds for relief activities, and the diversion of funding for development activities for post-disaster recovery. International experience has shown that this is an ineffective manner to deal with disaster risk which detracts from development objectives. This reactive approach is in contrast to a more effective proactive approach, in which disasters are avoided by appropriate land-use planning, construction and other pre-event measures which avoid the creation of disaster-prone conditions. This must also include the wide dissemination of information and early warning regarding the potential hazards and disasters in all areas. The government has, in theory a large disaster management framework but in practice the most important charge of District Disaster Management officer is given to Deputy Commissioner as an additional responsibility. Likewise, there exists very less coordination on the institutional and departmental level before, during and after a disaster has struck. Government must utilize its organs to the best of their ability and coordinate the working of each institution with the others working in the same area.
10. References
1. ACAPS. Secondary Data Review - Pakistan – Draft Version Onset Date : Period Covered : Secondary Data Review - Pakistan – Draft Version Summary Page 2 / 3.; 2010. http://www.acaps.org/img/documents/secondary-data-review-pakistan-secondary-data-review-pakistan.pdf.
2. Ali A. Indus Basin Floods: Mechanisms , Impacts , and Management.; 2013. http://adb.org/sites/default/files/pub/2013/indus-basin-floods.pdf.
3. Atmosphere U. Estimation of Snow Cover for Year 2013 ( Indus Basin ). 2013;2013.
4. Commission P. National Flood Reconstruction Plan 2010. 2010. http://waterinfo.net.pk/sites/default/files/knowledge/National Flood Reconstruction Plan 2010.pdf .
5. COMSATS. Flood Relief Campaign. http://www.umb.no/statisk/noragric/clusters/chsd/Flood interventions CIIT.pdf.
6. Disaster P, Authority M, Pakhtunkhwa K. Contingency Plan Monsoon 2012. 2012.
7. Fair C, Kuhn P, Malhotra N, Shapiro J. How Natural Disasters Affect Political Attitudes and Behavior: Evidence from the 2010-11 Pakistani Floods. ScholarPrincetonEdu. 2013. http://scholar.princeton.edu/sites/default/files/pmkuhn/files/FKMS_PakistanFloods2013.pdf.
8. Government of Pakistan. Pakistan: Flood Impact Assessment. Pakistan Econ Surv 2011-12. 2012;(September):247-258.
9. Khan PDAN. Brief Report On Activities of CDPM in Floods 2010 Brief Report On Activities of CDPM in Floods 2010.; 2010. http://cdpm.upesh.edu.pk/extras/CDPM_Flood 2010.pdf.
10. Mogwanja M, Shariff K. 1 Multi-Cluster Assessment of Charsadda and Nowshera Districts 1 August 2010 Composition:; 2010. https://bora.uib.no/bitstream/handle/1956/7432/108991226.pdf?sequence=1.
11. Mughal H. Nowshera, Pakistan.; 2013. http://www.preventionweb.net/files/31829_LGSAT_10Ess-Nowshera(2011-2013).pdf.
12. Pakistan G of. Pakistan Floods 2010: Preliminiary Damages and Needs Assessment. 2010.
13. PDMA-PaRRSA. Newsletter. 2010. http://pdma.gov.pk/Media Section/Newsletters/WADAN August 2010.pdf.
14. Programme PW. Rapid Assessment of Flood Impact on the Environment in Selected Affected Areas of Pakistan.; 2010. http://pakistanwetlands.org/reports/REIA of floods in selected areas - final.pdf.
15. Rodríguez-Oreggia E, Fuente AD La, Torre RD La. The Impact of Natural Disasters on Human Development and Poverty at the Municipal Level in Mexico. United Nations Dev Program Reg Bur Lat Am Caribb. 2008:1-27. doi:10.1080/00220388.2012.700398.
16. Ross E. Flood Rapid Assessment Report KHYBER PAKHTOONKHWA Districts. Peshawar, Nowshera, Charsadda http://floods2010.pakresponse.info/assessments/Pak_RI_Rapid_Assessment_KPK_6_Aug_2010.pdf.
17. Saleem S. Flood and Socio-Economic Vulnerability : New Challenges in Women ’ s Lives in Northern Pakistan. 2013. https://bora.uib.no/bitstream/handle/1956/7432/108991226.pdf?sequence=1.
18. Shafique M, Israr S, Shah MT, Khan MA. Remote sensing based strategy of stream sediment sampling for mineral exploration in Peshawar Basin , Khyber Pakhtunkhwa , Pakistan. 2014;47(2):141-148.
19. SUPARCO and FAO. Pakistan Flood /Rainds 2010. http://www.suparco.gov.pk/downloadables/PAKISTAN_FLOODRAIN.pdf.
20. The Centre for Research on the Epidemiology of Disasters (CRED). Technical References: DISASTER TYPES AND IMPACTS. Safer Homes, Stronger Communities a Handb Reconstr After Nat Disasters. 2010:339-345. doi:DOI: 10.1596/978-0-8213-8045-1.
21. Yousaf S, Zada A, Owais M. Physico-chemical characteristics of potable water of different sources in District Nowshera : A case study after flood – 2010. 2013;46(1):83-87. http://nceg.upesh.edu.pk/GeologicalBulletin/Vol-46(1)-2013/Vol-46(1)-2013-Paper9.pdf.
22. Chen L, Khan SD. Geomorphometric features and tectonic activities in sub-Himalayan thrust belt, Pakistan, from satellite data. Comput Geosci. 2009;35(10):2011-2019. doi:10.1016/j.cageo.2008.11.011.
[10] Ibid (Pg. 117)
[16] http://waterinfo.net.pk/sites/default/files/knowledge/National Flood Reconstruction Plan 2010.pdf (Pg. 70)
[17] http://floods2010.pakresponse.info/assessments/Pak_RI_Rapid_Assessment_KPK_6_Aug_2010.pdf (Pg. 03)
[21] http://floods2010.pakresponse.info/assessments/Pak_RI_Rapid_Assessment_KPK_6_Aug_2010.pdf (Pg. 03)
[23] http://floods2010.pakresponse.info/Multi_Cluster_Assessment_Report_Nowshera_1_Aug 2010.pdf (Pg. 02)
[25] http://www.dailymail.co.uk/news/article-1301214/Pakistan-fury-presidents-playboy-son-using-floods.html
[29] http://pakistanwetlands.org/reports/REIA%20of%20floods%20in%20selected%20areas%20-%20final.pdf (Pg. 23)
[34] http://pakistanwetlands.org/reports/REIA%20of%20floods%20in%20selected%20areas%20-%20final.pdf (Pg. 21)
[35] Ibid (Pg. 33)
[36] Ibid (Pg. 21)
[37] http://pakistanwetlands.org/reports/REIA%20of%20floods%20in%20selected%20areas%20-%20final.pdf(Pg. 23)
[38] Ibid (Pg. 32)
[39] Ibid (Pg. 23)
[43] Ibid (Pg. 04)
[44] Ibid (Pg. 03)
[45] Ibid (Pg. 08)
[46] Ibid (Pg. 07)
[47] Ibid (Pg. 07)
[48] Govt. of Sindh, Irrigation & Power Department Irrigation Secretariat. 1978 Bund Manual. Karachi, Pakistan.
Category: