Participatory Rural Appraisal (PRA) is an exercise for communication and transfer of knowledge. Regardless of whether it is carried out as part of project identification or appraisal or as part of country economic and sector work, the learning by doing and teamwork spirit of PRA requires transparent procedures. For that reason, a series of open meetings (an initial open meeting, final meeting, and follow up meeting) generally frame the sequence of PRA activities.
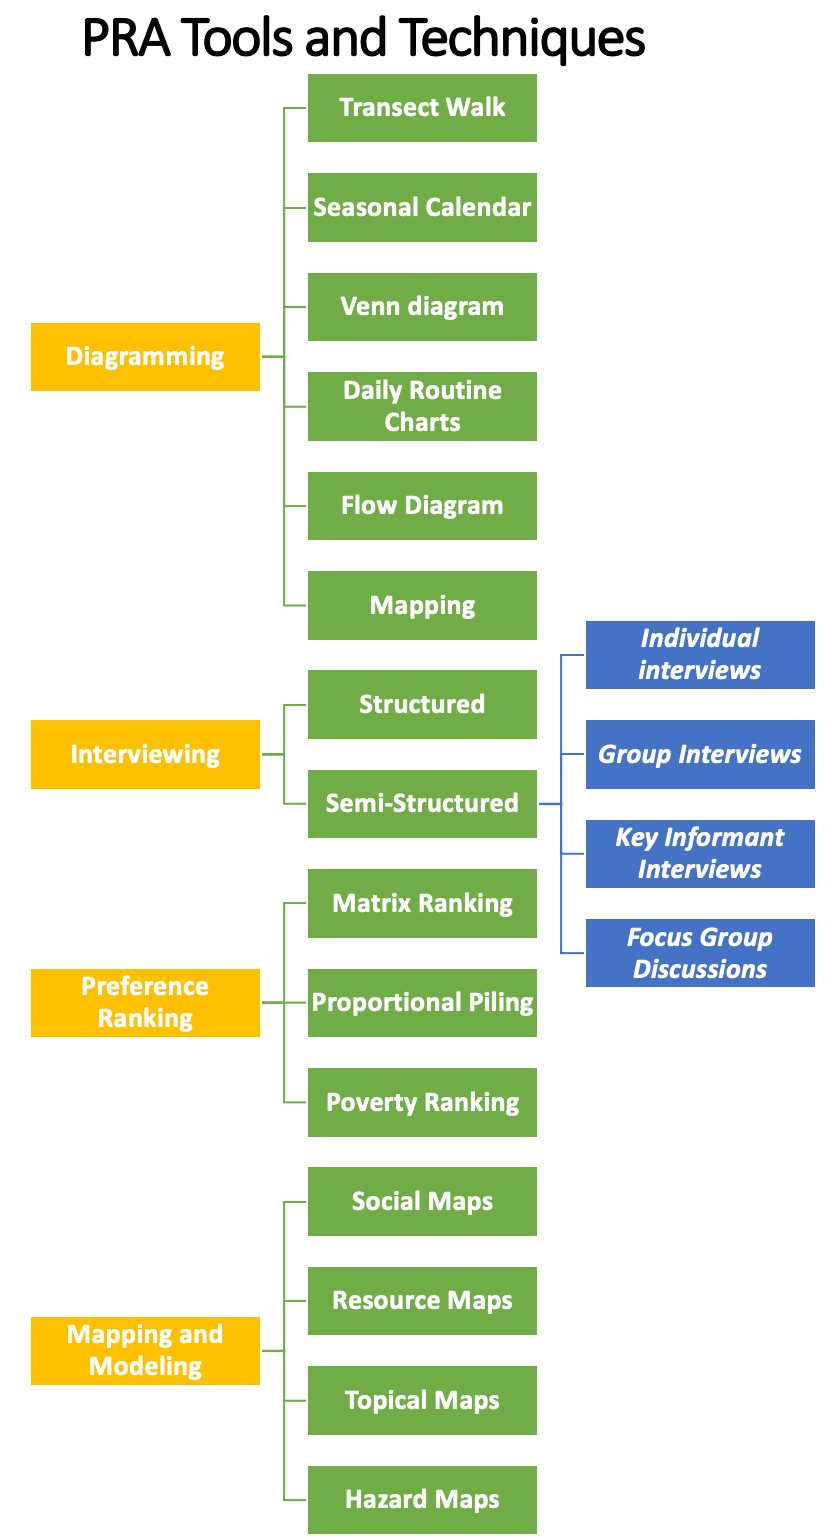 Participatory Rural Appraisal (PRA) is an approach that emphasizes the active involvement of community members in collecting and analyzing information about their own situation. PRA tools are used to facilitate this participatory process. Here are examples of PRA tools and their applications:
1. Diagramming
a. Transect Walk
Transects are observatory walks to study the natural resources, topography, indigenous technology, soils and vegetation, farming practices, problems and opportunities. These are done with a group of villagers-either following a particular course, cross country or covering the area. Community members walk through their area, noting different features and resources along a transect line. It helps identify key issues, changes, and patterns in the landscape and resource distribution.
b. Seasonal Calendar (info on problems that repeats in a certain period of time)
Seasonal Diagrams can be used for obtaining seasonal patterns of rainfall, employment, income/expenditure, diseases, livestock, production, workforce availability, crop pattern etc. A visual representation of the seasons and their associated activities, events, and problems. It helps identify seasonal vulnerabilities and plan accordingly.
c. Venn diagram
It is used to depict key institutions, organizations and individuals and their relationship with the local community or others. Key players in decision making are shown. On the Venn diagram each institution is represented by a circle. The size of the circle represents the importance, significance or power of that institutions. A diagram that shows the overlapping relationships between different elements or groups. It can be used to explore relationships between different community groups or identify shared concerns.
d. Daily Routine Charts
It is used to identify daily routine pattern of either gender in a particular area.it helps in analyzing work type and distribution of workloads throughout the day, for comparative analysis between different individuals daily schedules. Charts that depict the daily activities and routines of community members. They provide insights into time allocation, resource use, and work patterns. It helps:
- To identify the gender roles.
- To document the timings of the activities.
- For discussion of new activities and their implications for time use.
- For discussing time of meetings and training sessions
- To illustrate mobility and periods spent away from home.
e. Flow Diagram
Flow diagrams discover and analyze impacts and linkages. Current situations, constraints, problems and opportunities can be discussed as the effects of specific problems or interventions. A visual representation of processes or activities, showing the sequence of steps and interactions. It helps understand the flow of resources, decision-making, and information within the community.
f. Mapping
Maps are used to identify the comparative location and importance of different resources with in an area. They can examine a great breadth of subject matter, and allow for a range of different types of maps to be produced for one area, or for comparative analysis by different groups with in the same area. Creating maps to represent various aspects of the community, such as social networks, resource locations, or hazards. Mapping tools include participatory sketch mapping, aerial photographs, or Geographic Information Systems (GIS).
2. Interviewing
a. Structured
Pre-defined questions are asked to individuals or groups. It ensures consistent information collection and allows for quantitative analysis.
b. Semi-Structured
More flexible interviews that allow for open-ended questions and follow-up probes. They encourage detailed responses and deeper insights. SSI is a tool that can be used any time. SSI is guided interviewing, where only some of the questions are predetermined and new questions come up during the interview. The interviewer prepare a list of topics and questions rather than a fixed questionnaire.
i. Individual interviews
One-on-one interviews with community members to collect personal experiences, opinions, and perspectives.
ii. Group Interviews
Interviews conducted with a small group of community members. They promote discussions and interactions among participants.
iii. Key Informant Interviews
Interviews with knowledgeable individuals who have valuable insights or expertise on specific topics.
iv. Focus Group Discussions
Facilitated group discussions that encourage participants to share their opinions, experiences, and perceptions on a particular topic.
3. Preference Ranking
Ranking of problems, issues, solutions on the basis of needs or personal preference
a. Matrix Ranking
Community members rank different options or criteria based on their preference or importance. It helps identify priority areas or preferences. The main objective here is to prioritize the issues at hand such as:
- It allows us to see individual and group priorities and can also be applied on the uneducated and illiterate groups in a community.
b. Proportional Piling
Participants allocate resources or options based on their perceived importance or preference. It visually represents the distribution of preferences. It is a measure of relative importance of issues and thus helps in obtaining data from respondents in relative terms. Moreover, it can also be used for questions whose answers people don’t like to give directly e.g. income levels, expenditures etc.
c. Poverty Ranking
A participatory tool where community members collectively rank households according to their perceived level of poverty. It helps identify vulnerable households and target interventions accordingly.
4. Mapping and Modeling
The making of maps that depicts conditions and environment of the area is called mapping. It increases the knowhow of the natives about their surrounding and the physical features of the area.
a. Social Maps
Mapping of social structures, relationships, and networks within the community. It helps identify influential individuals, groups, and support systems. Consists of household information such as population density, social classes, land use etc.
b. Resource Maps
Maps that represent the distribution and availability of natural resources, infrastructure, or services in the community. It helps understand resource access and utilization patterns. Shows resources of the area like soil, water, minerals etc.
c. Topical Maps
Maps that focus on specific topics, such as health facilities, schools, or agricultural areas. They provide detailed information on specific sectors or themes. Contains information about physical features of the area, crops grown in the area, population and infrastructure facilities present in the area.
d. Hazard Maps
Maps that identify and visualize potential hazards and their impact on the community. It helps assess vulnerability and plan risk reduction strategies. Showing areas that can be affected by hazards.
Category: